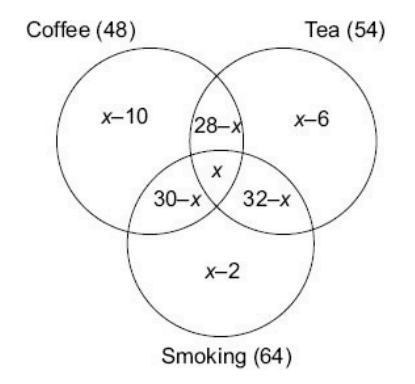
Data for Questions 1 to 7 : In a survey among students at all the IIMs, it was found that 48% preferred coffee, 54% liked tea and64% smoked. Of the total, 28% liked coffee and tea, 32% smoked and drank tea and 30% smoked and drank coffee. Only 6% did none of these. If the total number of students is 2000 then find
1. The ratio of the number of students who like only coffee to the number who like only tea is
a) 5:3
b) 8:9
c) 2:3
d) 3:2
Explanation:
We can then solve this as:
x – 10 + 28 – x + x + 30 – x + x + 2 + 32 – x + x – 6 = 94
x + 76 = 94
x = 18.
In this question, since all the values for the use of the set theory formula are given, we can find the missing value of students who liked all three as follows:
94 = 48 + 54 + 64 – 28 – 32 – 30 + All three
All three = 18
As you can see this is a much more convenient way of solving this question, and the learning you take away for the 3 circle situation is that whenever you have all the values known and the only unknown value is the center value – it is wiser and more efficient to solve for the unknown using the formula rather than trying to solve through a venn diagram.
Based on this value of x we get the diagram completed as:
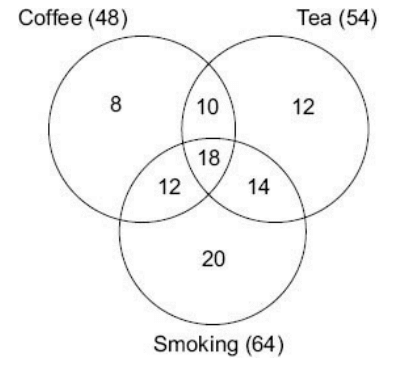
8:12 = 2:3
Option (c) is correct
2. Number of students who like coffee and smoking but not tea is
a) 600
b) 240
c) 280
d) 360
Explanation: 12 % of 2000 = 240.
Option (b) is correct.
3. The percentage of those who like coffee or tea but not smoking among those who like at least
one of these is
a) more than 30
b) less than 30
c) less than 25
d) none of these
Explanation: 30/94
more than 30%.
Option (a) is correct
4. The percentage of those who like at least one of these is
a) 100
b) 90
c) Nil
d) 94
Explanation: 94%.
Option (d) is correct
5. The two items having the ratio 1:2 are
a) Tea only and tea and smoking only
b) Coffee and smoking only and tea only
c) Coffee and tea but not smoking and smoking but not coffee and tea.
d) None of these
Explanation: Option (c) is correct as the ratio turns out to be 10:20 in that case.
6. The number of persons who like coffee and smoking only and the number who like tea only
bear a ratio
a) 1:2
b) 1:1
c) 5:1
d) 2:1
Explanation: 12:12 = 1:1
Option (b) is correct.
7. Percentage of those who like tea and smoking but not coffee is
a) 14
b) 14.9
c) less than 14
d) more than 15
Explanation: 14%
Option (a) is correct
8. 30 monkeys went to a picnic. 25 monkeys chose to irritate cows while 20 chose to irritate
buffaloes. How many chose to irritate both buffaloes and cows?
a) 10
b) 15
c) 5
d) 20
Explanation: 30 = 25 + 20 – x
x = 15.
Option (b) is correct
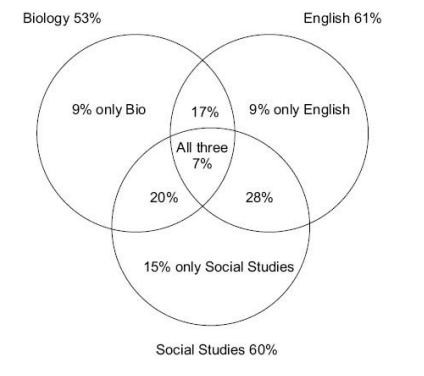
Data for Questions 9 to 12 : In the CBSE Board Exams last year, 53% passed in Biology, 61% passed in English, 60% in SocialStudies, 24% in Biology & English, 35% in English & Social Studies, 27% in Biology and SocialStudies and 5% in none.
9. Percentage of passes in all subjects is
a) Nil
b) 12
c) 7
d) 10
Explanation: Let people who passed all three be x. Then:
53 + 61 + 60 – 24 – 35 – 27 + x = 95
x = 7
10.If the number of students in the class is 200, how many passed in only one subject?
a) 48
b) 46
c) more than 50
d) less than 40
Explanation: 33% of 200 = more than 50.
Option (c) is correct.
11. If the number of students in the class is 300, what will be the % change in the number of
passes in only two subjects, if the original number of students is 200?
a) More than 50%
b) Less than 50%
c) 50%
d) None of these
Explanation: If the number of students is increased by 50%, the number of students in each category would also be increased by 50%.
Option (c) is correct.
12. What is the ratio of percentage of passes in Biology and Social Studies but not English in
relation to the percentage of passes in Social Studies and English but not Biology?
a) 5:7
b) 7:5
c) 4:5
d) None of these
Explanation: 20:28 = 5:7
Option (a) is correct.